Many who look beyond the insane rhetoric of never ending lowered taxes for the super-rich, while insisting that Americans work until they drop dead rather than depend on Social Security or Medicare, may have some statistics to back up the concern that the economic policies and direction of the past 12 years has not been healthy for America.
The following is from The Middle Class in America Is Radically Shrinking. Here Are the Stats to Prove it.
• 83 percent of all U.S. stocks are in the hands of 1 percent of the people.
• 61 percent of Americans “always or usually” live paycheck to paycheck, which was up from 49 percent in 2008 and 43 percent in 2007.
• 66 percent of the income growth between 2001 and 2007 went to the top 1% of all Americans.
• 36 percent of Americans say that they don’t contribute anything to retirement savings.
• A staggering 43 percent of Americans have less than $10,000 saved up for retirement.
• 24 percent of American workers say that they have postponed their planned retirement age in the past year.
• Over 1.4 million Americans filed for personal bankruptcy in 2009, which represented a 32 percent increase over 2008.
• Only the top 5 percent of U.S. households have earned enough additional income to match the rise in housing costs since 1975.
• For the first time in U.S. history, banks own a greater share of residential housing net worth in the United States than all individual Americans put together.
• In 1950, the ratio of the average executive’s paycheck to the average worker’s paycheck was about 30 to 1. Since the year 2000, that ratio has exploded to between 300 to 500 to one.
• As of 2007, the bottom 80 percent of American households held about 7% of the liquid financial assets.
• The bottom 50 percent of income earners in the United States now collectively own less than 1 percent of the nation’s wealth.
• Average Wall Street bonuses for 2009 were up 17 percent when compared with 2008.
• In the United States, the average federal worker now earns 60% MORE than the average worker in the private sector.
• The top 1 percent of U.S. households own nearly twice as much of America’s corporate wealth as they did just 15 years ago.
• In America today, the average time needed to find a job has risen to a record 35.2 weeks.
• More than 40 percent of Americans who actually are employed are now working in service jobs, which are often very low paying.
• or the first time in U.S. history, more than 40 million Americans are on food stamps, and the U.S. Department of Agriculture projects that number will go up to 43 million Americans in 2011.
• This is what American workers now must compete against: in China a garment worker makes approximately 86 cents an hour and in Cambodia a garment worker makes approximately 22 cents an hour.
• Approximately 21 percent of all children in the United States are living below the poverty line in 2010 – the highest rate in 20 years.
• Despite the financial crisis, the number of millionaires in the United States rose a whopping 16 percent to 7.8 million in 2009.
• The top 10 percent of Americans now earn around 50 percent of our national income.
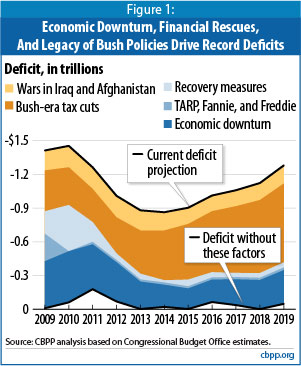
What are the vast majority of Americans who are suffering from this supposed to do, when you have Republicans running on a platform that insists on extending the tax cuts on the super-rich from the Bush Era? Tax cuts that PRODUCED the current deficit and runaway national debt, has been demonstrated again and again by economists motivated by truth, not dogma or a corporate controlled media.
The following graph, from the Center on Budget and Policy Priorities, says it all.


